
BI & Dashboard Service
Expertise for BI Platform
Our ambition: through our experience, help your performance take off. With years of experience in business intelligence and EPM tools, our consultants are ready to address your issues. The added value of BSAI Techno Sales consultants is a dual business and technical qualification. They are the unique contacts of your decision-making projects. The project methodologies and best practices that we have developed with our clients have allowed us to create solutions for all company departments.
- Our Expertise helps you to evaluate and recomend the best BI technology.
- Hand over visualizations on various tools i.e. Microsfot Power BI, GoodData, Tableau, Qlikview, Pentaho…
- Develop solutions on Microsoft technologies, Microstrategy, SAP BO…
- Recomend BI solutions with Oracle, HP Vertica, Hadoop, SAP Hana, Red Shift etc
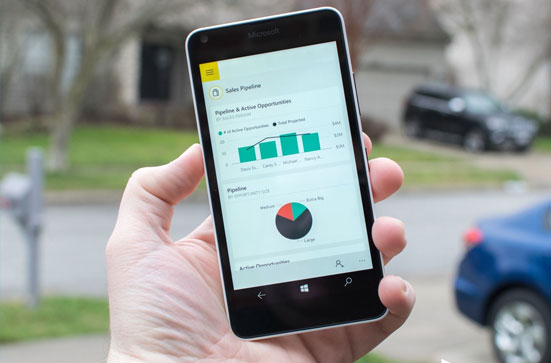
BI for Mobile
BSAI Techno Sales offers a complete business analytics platform, including interactive analysis, rich visualizations, executive dashboards, and enterprise reporting. With BSAI Techno Sales, you receive a consistent business intelligence and analytics experience across your desktop, laptop and iPad.
- Immersive mobile business intelligence, fully touch-enabled.
- Interactive boardroom-style dashboards, reports and visualizations.
- Exploration of any data with a broad set of interactive charts types, including Bubble Charts, Scatter Plots, Heat Grids, Geo-Maps, and more.
- Build and edit multi-dimensional analysis, visualizations, and reports from the iPad – without any help from IT.
- Native navigation and browsing – Pinch to zoom, tap to select, drag and drop, and swipe through open documents.
- Personalize the user experience – tagging favorites, customizing start-up location.

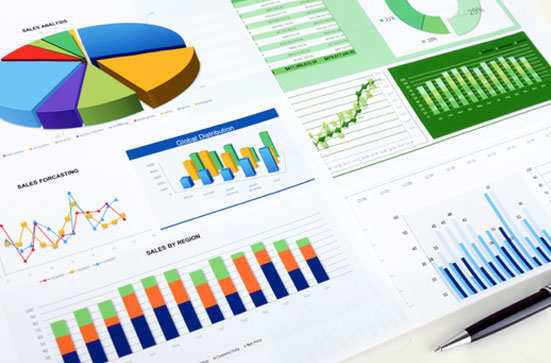
Data Visualization
If a picture is worth thousand words, then what about a neat data visualization? Displaying information in graphics to generate better insights is not a new phenomenon, but, with the advent of technology and increased access to data, it has become far more prominent. Once restricted to analysis of economics, finance, and science, data visualization has emerged as an industry of its own. Data visualization allows us to identify these sorts of trends, along with problems and possible solutions. This makes it a valuable tool for anyone — especially those working in policy. Policymakers use swathes of data across sectors to make important decisions. In this ocean of information, data visualization can quickly show them what needs to be refined or aborted. In a country as diverse and large as India, data visualization’s ability to show data effectively and quickly is paramount.
- Get a clear picture of various data types
- Integreate BI solutions with Hadoop, SAP Hana, Red Shift, Big Insights etc
- Monitor information faster

Interactive Reporting Service
Do you want to take firm command of every process, project, and piece of your business? You can do this with Absolute Reporting Service.We provide you a complete range of enterprise reporting services with expertise in all leading BI technologies in Microsoft, Oracle, Microstrategy, Qlikview, Tableau, SAP BO and in the Gartner Magic Quadrant. Reports can be ongoing (from new data sets), on demand or scheduled periodically.
- We help you to get professionally designed custom reports
- We can process and update outdated reports
- Convert your reports into influential decision making dashboards
- Manage scheduled reports automatically according to daily, weekly, monthly wise
- Use premise solutions cloud-based or
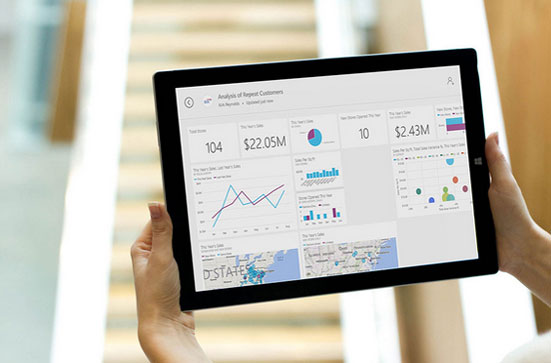
Interactive Dashboards
BSAI Techno Sales includes a host of new features designed to improve the user experience, including custom dashboard backgrounds, ability to control chart transparency, search capability across charts and dashboards, and an enhanced user interface. It extends world class dashboard application into a comprehensive business intelligence platform which includes alerts, analytics and reports. It helps institutions leverage information assets through visually rich, real-time and personalized business intelligence dashboards to analyze, track, and drilldown through a wealth of information. It’s an intelligent & interactive tool on a whole new level.
- Built Intelligent custom dashboards as per your specification
- Retrive data fast with dynamic controls
- Access you data from mobile devices and laptops, anytime
- Empower your team with data information